
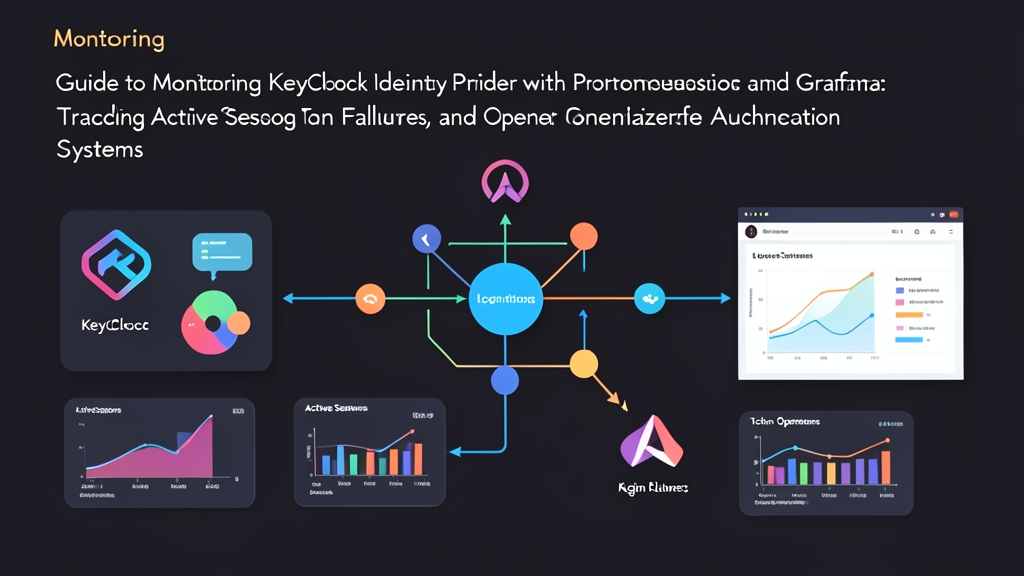
Background & Why Keycloak Becomes a Bottleneck
About 6 months ago, our team consolidated all login flows from 6 internal microservices into Keycloak via OIDC. At the time, daily request volume hit 120,000. Everything seemed to be running smoothly — until Keycloak became a critical Single Point of Failure. If this IdP cluster responded 2 seconds late or ran out of connection pool connections to PostgreSQL, all users across all 6 services would be stuck at the login screen.
Our monitoring stack uses Prometheus and Grafana to manage around 15 nodes. Before instrumenting Keycloak with metrics, every incident was like searching for a needle in a haystack. Once, a password-scanning test script pushed CPU to 95%. Another time, a frontend bug caused an infinite token refresh loop that overwhelmed the database. The on-call team could only stare helplessly at the red CPU graphs.
Adding proper metrics to Keycloak lets the team pinpoint three core pain points: Login Failures, Active Sessions, and Token Operations — all in real time.
Setup
Since Keycloak’s Quarkus-based release (Keycloak 17+), enabling metrics is far easier than in the WildFly era. Keycloak ships with Micrometer built in and exposes a standard Prometheus-compatible endpoint out of the box.
You just need to inject a few environment variables into the container. Below is the actual docker-compose.yml our team is running:
version: '3.8'
services:
  keycloak:
    image: quay.io/keycloak/keycloak:24.0.5
    container_name: keycloak-idp
    command: start --optimized
    environment:
      KC_DB: postgres
      KC_DB_URL: jdbc:postgresql://postgres:5432/keycloak
      KC_DB_USERNAME: keycloak
      KC_DB_PASSWORD: strongpassword123
      KC_HOSTNAME: auth.lab.internal
      KC_METRICS_ENABLED: "true"
      KC_HEALTH_ENABLED: "true"
      KC_HTTP_MANAGEMENT_PORT: 9000
    ports:
      - "8080:8080"
      - "9000:9000"
    restart: unless-stopped
One important note: Keycloak separates the management port to port 9000. The metrics endpoint will be at http://keycloak-idp:9000/metrics, not on the application port 8080.
This design is far more secure: port 8080 is exposed through Nginx/Ingress for external users, while port 9000 is only accessible internally for Prometheus to scrape.
Detailed Configuration
Once the container is running, use curl to quickly test the metrics endpoint:
curl -s http://localhost:9000/metrics | head -n 25
If you see lines prefixed with jvm_memory_*, agroal_*, or http_server_requests_seconds_* appearing continuously, the system is ready to go.
1. Declaring the Scrape Job in Prometheus
Open prometheus.yml and add a scrape config with a 15-second interval:
scrape_configs:
  - job_name: 'keycloak'
    scrape_interval: 15s
    scrape_timeout: 10s
    metrics_path: '/metrics'
    static_configs:
      - targets: ['192.168.1.50:9000']
        labels:
          env: 'production'
          service: 'identity-provider'
Reload Prometheus immediately without restarting the process:
curl -X POST http://localhost:9090/-/reload
2. The Most Valuable PromQL Expressions
Keycloak exports hundreds of metrics, but in production you really only need these 4 PromQL expressions pinned to your dashboard:
- Active Sessions by Realm: Measures the number of simultaneously active sessions. This figure helps you accurately allocate RAM for the Infinispan cache:
sum(keycloak_active_user_sessions) by (realm) - Login Failure Rate (per minute): If the graph spikes above 30 failures/minute, there is a 90% chance someone is running a brute-force password-scanning script:
sum(rate(keycloak_failed_login_attempts_total[5m])) by (realm, client_id) * 60 - Token Issue & Refresh Rate: Detect clients with bugs causing an infinite token refresh loop that congests the thread pool:
sum(rate(keycloak_token_exchange_total[5m])) by (realm, client_id) - Request Latency (P95 Response Time): Monitor Keycloak’s authentication request processing time. When P95 exceeds 1.5 seconds, check PostgreSQL I/O:
histogram_quantile(0.95, sum(rate(http_server_requests_seconds_bucket{uri=~"/realms/.*"}[5m])) by (le))
Production Monitoring & Alerts
In Grafana, you can build panels from the 4 PromQL expressions above or import a community dashboard (the popular dashboard ID for Keycloak Quarkus is 18635). Building panels by hand gives you a much deeper understanding of what each metric fluctuation actually means.
Setting Up Proper Alert Rules
A beautiful dashboard won’t save your system if the engineer is asleep. Here are 2 alert rules configured to send notifications directly to Telegram/Slack via Alertmanager:
groups:
  - name: keycloak_alerts
    rules:
      - alert: KeycloakHighLoginFailures
        expr: sum(rate(keycloak_failed_login_attempts_total[5m])) by (realm) * 60 > 30
        for: 3m
        labels:
          severity: warning
        annotations:
          summary: "Spike in login failures detected in realm {{ $labels.realm }}"
          description: "More than 30 failed login attempts per minute for 3 consecutive minutes. Suspected brute-force or credential stuffing."

      - alert: KeycloakSlowResponseTime
        expr: histogram_quantile(0.95, sum(rate(http_server_requests_seconds_bucket[5m])) by (le)) > 2.0
        for: 2m
        labels:
          severity: critical
        annotations:
          summary: "Keycloak responding very slowly (P95 > 2s)"
          description: "P95 latency reached 2 seconds for 2 minutes. Downstream services are at risk of gateway timeouts."
3 Hard-Won Lessons After 6 Months in Production
After many late-night production shifts and a few unforgettable incidents, here are 3 lessons you should apply right away:
- Don’t set Session Idle too long: On day one of our rollout, we set
SSO Session Idleto 30 days. The result: over 45,000 stale sessions accumulated, causing the Infinispan cache to consume 5.2 GB of RAM. Reducing idle to 8 hours and session max to 24 hours immediately cut RAM usage by 60%. - Lock down port 9000: The metrics endpoint can expose Realm names, Client names, and usernames if misconfigured. Block port 9000 with
ufwor isolate it within a Docker internal network, allowing only your Prometheus IP through. - Watch the Database Connection Pool closely: When P95 latency climbs but user volume hasn’t spiked, check the
agroal_active_countmetric right away. In our system, increasingKC_DB_POOL_MAX_SIZEfrom 20 to 60 definitively resolved the bottleneck during peak traffic at 9 AM.
With Prometheus and Grafana in the mix, operating Keycloak becomes far less stressful. Instead of waiting for users to complain on Slack, the ops team stays ahead of anomalies and addresses issues before they escalate into full-blown incidents.