
Problem Overview
Managing a company-wide VPN for remote teams is never a walk in the park. The connection suddenly grinds to a halt. Slack starts blowing up: ‘Why is the network so slow?’, ‘Who’s downloading torrents or running backups?’, or ‘Is user dev-01 connected to the VPN right now?’.
By default, OpenVPN only records session status to a basic text file or exposes it via a telnet management interface. Every time the network acts up, having to SSH into the server and manually grep logs is both slow and frustrating. In our internal infrastructure with around 80 concurrent connections, I integrated OpenVPN Exporter into our existing Prometheus cluster. This transformed raw text data into clean, visual dashboards in Grafana. Whenever someone downloads huge files and saturates the office’s 100 Mbps uplink, they are identified within seconds.
Core Concepts
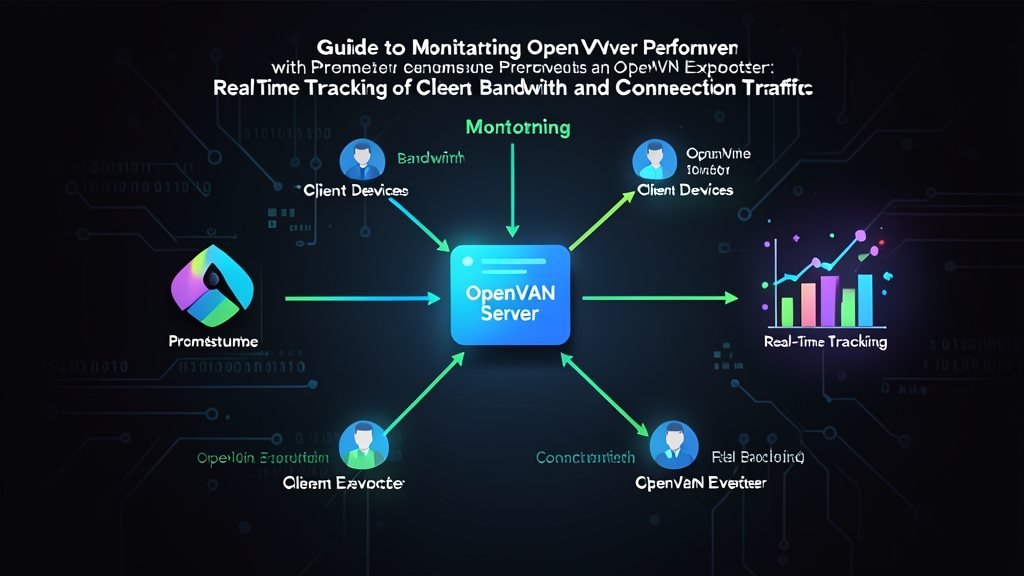
This monitoring architecture consists of three tightly connected components:
- OpenVPN Status Log: OpenVPN periodically dumps session state to disk. This file contains the routing table, Common Name (username), real IP, virtual IP (10.8.0.x), transferred byte counts, and connection timestamps.
- OpenVPN Exporter: A Go binary (most commonly
kumina/openvpn_exporter). It periodically reads the status log, parses the raw text data, and exposes Prometheus metrics on port 9176. - Prometheus Server: The monitoring server that scrapes metrics from the exporter every 15 seconds. This time-series data feeds Grafana dashboards and Alertmanager alerting rules.
Key metrics you should keep an eye on include:
openvpn_up: Indicates whether the VPN service is running or down (1/0).openvpn_server_connected_clients: Total number of currently active users.openvpn_server_route_sent_bytes: Bytes sent by the server to the client (corresponding to the client’s download speed).openvpn_server_route_received_bytes: Bytes received by the server from the client (corresponding to the client’s upload speed).
Step-by-Step Implementation
Step 1: Enable Status Logging on the OpenVPN Server
OpenVPN must write its state to disk so the exporter can read it. Open your primary server configuration file (typically located at /etc/openvpn/server/server.conf or /etc/openvpn/server.conf):
sudo nano /etc/openvpn/server/server.confFind and add (or verify) the following two configuration lines:
status /run/openvpn-server/status-server.log 10
status-version 2
The 10 parameter tells OpenVPN to flush the file every 10 seconds. The status-version 2 setting forces OpenVPN to use a comma-delimited format (CSV), making it much easier for the parser to extract fields reliably. Save the file and restart the service:
sudo systemctl restart [email protected]
# Verify that the log file is being generated:
sudo head -n 10 /run/openvpn-server/status-server.log
Step 2: Install and Configure OpenVPN Exporter
Download the latest openvpn_exporter release binary from GitHub onto your server:
cd /tmp
OVPN_EXP_VER="v0.3.0"
wget https://github.com/kumina/openvpn_exporter/releases/download/${OVPN_EXP_VER}/openvpn_exporter-${OVPN_EXP_VER}.linux-amd64.tar.gz
tar -xvf openvpn_exporter-${OVPN_EXP_VER}.linux-amd64.tar.gz
sudo mv openvpn_exporter-${OVPN_EXP_VER}.linux-amd64/openvpn_exporter /usr/local/bin/
sudo chmod +x /usr/local/bin/openvpn_exporter
To ensure the exporter starts automatically on boot and recovers from failures, set up a Systemd service:
sudo tee /etc/systemd/system/openvpn_exporter.service > /dev/null <<EOF
[Unit]
Description=Prometheus OpenVPN Exporter
After=network.target [email protected]

[Service]
Type=simple
User=root
ExecStart=/usr/local/bin/openvpn_exporter -openvpn.status_paths /run/openvpn-server/status-server.log -web.listen-address :9176
Restart=always
RestartSec=5

[Install]
WantedBy=multi-user.target
EOF
Reload the systemd configuration and start the exporter:
sudo systemctl daemon-reload
sudo systemctl enable --now openvpn_exporter
sudo systemctl status openvpn_exporter --no-pager

# Test the metrics endpoint
curl -s http://localhost:9176/metrics | grep openvpn_server_
If the terminal prints a series of metrics alongside the names of active clients, the exporter is working as expected.
Step 3: Configure the Scrape Job in Prometheus
With the exporter listening on port 9176, head over to your Prometheus node to collect the data. Add a new scrape job under the scrape_configs section in prometheus.yml:
scrape_configs:
  - job_name: 'openvpn'
    scrape_interval: 15s
    static_configs:
      - targets: ['192.168.1.10:9176'] # Replace with your OpenVPN server IP
        labels:
          environment: 'production'
          service: 'remote-vpn'
Validate the configuration syntax before applying changes:
promtool check config /etc/prometheus/prometheus.yml
curl -X POST http://localhost:9090/-/reload
Navigate to the Prometheus web UI under Status > Targets. If the openvpn target displays a green UP status, your scraping pipeline is operational.
Step 4: Query and Analyze Client Traffic
Now that metrics are streaming in, open the Expression Browser in Prometheus (port 9090) and try running these four PromQL queries:
- Total number of connected clients:
openvpn_server_connected_clients - Instantaneous download rate per user (bytes/sec – sent by server):
rate(openvpn_server_route_sent_bytes[1m]) - Instantaneous upload rate per user (bytes/sec – received by server):
rate(openvpn_server_route_received_bytes[1m]) - Top 3 bandwidth-heavy users over the last 5 minutes:
topk(3, sum by (common_name) (rate(openvpn_server_route_sent_bytes[5m]) + rate(openvpn_server_route_received_bytes[5m])))
For visualization, you can import dashboard template ID 10562 in Grafana. This dashboard provides clear insights: active connection trends across work shifts, alerts when a user exceeds 30 Mbps for over 10 minutes, and detailed client IP listings paired with session uptime stats.
Conclusion
This monitoring setup puts an end to shooting in the dark whenever your team’s VPN slows down. With about 15 minutes of configuration, you gain full visibility into your network: who is online, how much bandwidth each person consumes, and when bottlenecks occur. Instead of constantly putting out fires, Sysadmin and DevOps teams can proactively optimize QoS and keep infrastructure running smoothly.