A Real-World Nightmare: 2 AM and the 502 Bad Gateway
Everything seemed flawless after an 8 PM deployment. Traffic was steady, orders were climbing nicely. Then, at 2 AM sharp, urgent notifications started blowing up your phone from your uptime monitoring system: the entire application was down with a 502 Bad Gateway error. Frantically flipping open your laptop and checking the terminal, you realize the checkout service container has vanished into thin air.
During an e-commerce project running around 15 microservices, I once spent two agonizing days wrestling with a memory leak. Every 4 to 6 hours, server RAM usage would creep from baseline up to 98% of its 8GB capacity. The temporary fix back then? Frantically restarting containers just to give the system some breathing room. But within hours, the same nightmare repeated. Without metrics, our team was completely flying blind—wildly guessing between Node.js logic and PostgreSQL queries without ever pinpointing where system resources were vanishing.
Root Cause Analysis: Why Docker Often Leaves You Flying Blind
Picture Docker as a gated apartment building where each container is a self-contained unit. Standing at the front gate (the host machine), you only know the entire building is pulling 100 kW of power—with no clue which apartment is blasting the AC at 16°C and tripping the main breaker.
Here are the three biggest hurdles that make managing containers without proper tooling so challenging:
- Lack of historical data: Basic CLI tools only provide instantaneous metrics. Once a crash occurs, you have no way to look back and see which container suddenly spiked to 100% CPU 15 minutes earlier.
- Distributed container sprawl: A typical microservices architecture easily runs 10 to 30 processes simultaneously (web apps, caches, queue workers, databases). Inspecting each service manually is virtually impossible.
- Silent deaths: When hitting the memory ceiling, the Linux kernel’s Out-Of-Memory (OOM) Killer silently terminates the offending container without any advance warning.
Common Approaches Today
Before building a dedicated monitoring stack, developers typically turn to two common approaches:
Approach 1: Manual Monitoring with docker stats
The quickest option that immediately comes to mind:
docker statsYour terminal immediately streams live figures for CPU, RAM, and network I/O. However, while tools like the Docker Events API can capture lifecycle events, the fatal flaw of manual CLI commands is that you have to stare at a live terminal window. The moment you close the session, all data is lost—leaving you with zero historical graphs over hours or weeks to analyze traffic trends.
Approach 2: Using SaaS Solutions (Datadog, New Relic)
These platforms offer a stellar out-of-the-box experience. Simply install an agent, and pre-built dashboards populate automatically within an intuitive web interface.
However, cost is a major barrier. Datadog charges around $15–$23 per monitored host per month, excluding additional fees for custom metrics and logs. For small-to-medium projects, the monitoring bill can easily cost twice as much as the VPS hosting the application itself.
The Optimal Solution: cAdvisor + Prometheus + Grafana via Docker Compose
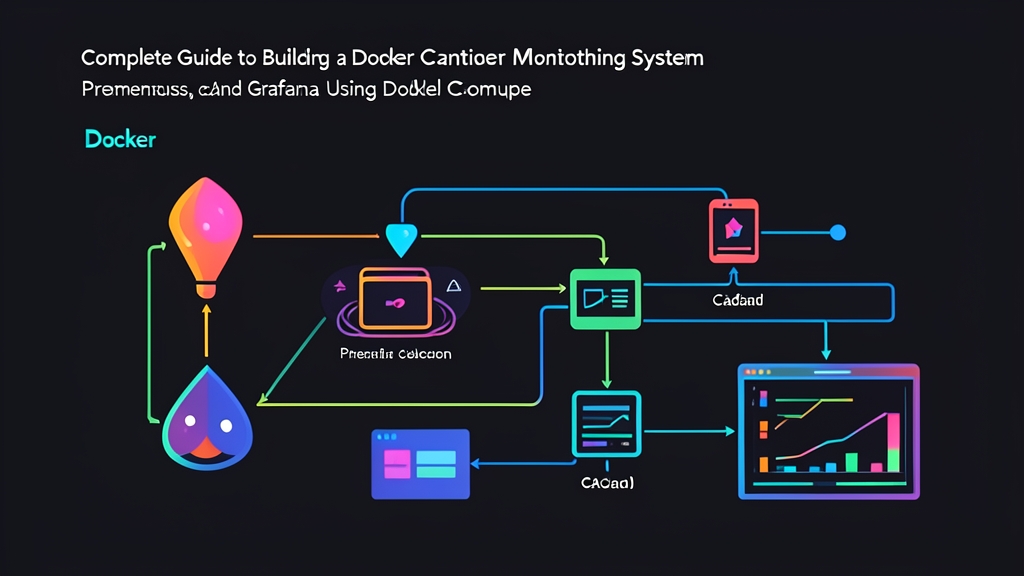
The best balance between performance and cost is hosting your own open-source stack directly on existing infrastructure. These three tools work seamlessly together in a closed-loop workflow:
- cAdvisor (Metric Collection): Reads directly from Linux cgroups and the Docker daemon, measuring real-time CPU, RAM, network, and disk I/O metrics for every container.
- Prometheus (Time-Series Storage): Periodically scrapes (pulls) metrics from cAdvisor and stores them in a highly optimized time-series database.
- Grafana (Visualization): Queries Prometheus data, transforms raw time-series metrics into interactive dashboards, and supports threshold-based alerts for anomalies.
Step 1: Prepare the Prometheus Configuration File
Create a prometheus.yml file to define the scraping target for cAdvisor:
global:
  scrape_interval: 5s

scrape_configs:
  - job_name: 'cadvisor'
    static_configs:
      - targets: ['cadvisor:8080']
Step 2: Define docker-compose.yml
Place the docker-compose.yml file in the same directory with the following content:
version: '3.8'

services:
  cadvisor:
    image: gcr.io/cadvisor/cadvisor:v0.49.1
    container_name: monitoring-cadvisor
    restart: unless-stopped
    privileged: true
    volumes:
      - /:/rootfs:ro
      - /var/run:/var/run:ro
      - /sys:/sys:ro
      - /var/lib/docker/:/var/lib/docker:ro
      - /dev/disk/:/dev/disk:ro
    expose:
      - 8080
    networks:
      - monitoring-net

  prometheus:
    image: prom/prometheus:v2.51.0
    container_name: monitoring-prometheus
    restart: unless-stopped
    volumes:
      - ./prometheus.yml:/etc/prometheus/prometheus.yml:ro
      - prometheus_data:/prometheus
    ports:
      - "9090:9090"
    command:
      - '--config.file=/etc/prometheus/prometheus.yml'
      - '--storage.tsdb.path=/prometheus'
    networks:
      - monitoring-net

  grafana:
    image: grafana/grafana:10.4.0
    container_name: monitoring-grafana
    restart: unless-stopped
    ports:
      - "3000:3000"
    environment:
      - GF_SECURITY_ADMIN_USER=admin
      - GF_SECURITY_ADMIN_PASSWORD=adminpass
    volumes:
      - grafana_data:/var/lib/grafana
    networks:
      - monitoring-net


volumes:
  prometheus_data:
  grafana_data:

networks:
  monitoring-net:
    driver: bridge
Step 3: Launch and Set Up the Dashboard
Bring up the entire stack with a single command (or manage it easily via a GUI like Dockge):
docker compose up -dSetting up your Grafana dashboard takes just a few clicks:
- Open your browser and navigate to
http://IP-SERVER:3000using the default credentialsadmin / adminpass. - Go to Connections > Data Sources, select Prometheus, enter the internal URL
http://prometheus:9090, and click Save & test. - Navigate to Dashboards > Import, enter template ID
14282(a community-standard, optimized dashboard for cAdvisor).
Your complete dashboard will load immediately. Comprehensive charts detailing CPU usage, real-time memory consumption, disk I/O, and network bandwidth per container are displayed clearly. Now, a quick glance at the memory slope over 2 to 3 hours lets you spot memory leaks long before the host gets hit by an OOM crash or production server crashes.