
Skip to content
ITFROMZERO - Share tobe shared!
  • Home
  • AI
  • Database
  • Docker
  • Git
  • Linux
  • Network
  • Virtualization
  • English
    • Tiếng Việt
    • English
    • 日本語
  • Home
  • AI
  • Database
  • Docker
  • Git
  • Linux
  • Network
  • Virtualization
  • English
    • Tiếng Việt
    • English
    • 日本語
  • Facebook

telemetry

Monitoring tutorial - IT technology blog
Posted inMonitoring

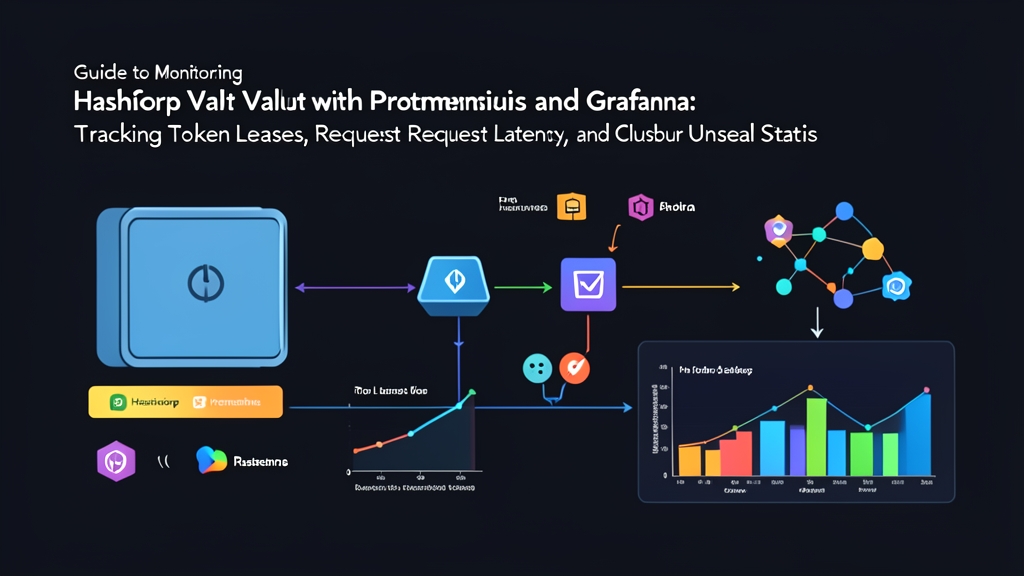
How to Monitor HashiCorp Vault with Prometheus and Grafana: Tracking Token Leases, Request Latency, and Unseal Status

Posted by By IT From Zero October 25, 2026
A detailed guide to monitoring HashiCorp Vault with Prometheus and Grafana. Learn how to collect internal telemetry, measure request latency, manage token leases, and detect sealed cluster nodes early.

Read More
Monitoring tutorial - IT technology blog
Posted inMonitoring

Getting Started with Grafana Alloy: Replace Prometheus Agent, Promtail, and OpenTelemetry Collector with a Single Telemetry Collection Tool

Posted by By IT From Zero June 2, 2026
Grafana Alloy merges Prometheus Agent, Promtail, and OpenTelemetry Collector into a single binary. This guide covers installation, configuring a pipeline to collect metrics, logs, and traces, along with practical tips from 6 months of running it in production.
Read More
Copyright 2026 — ITFROMZERO. All rights reserved.
Privacy Policy | Terms of Service | Contact: [email protected] DMCA.com Protection Status
Scroll to Top