Posted inMonitoring
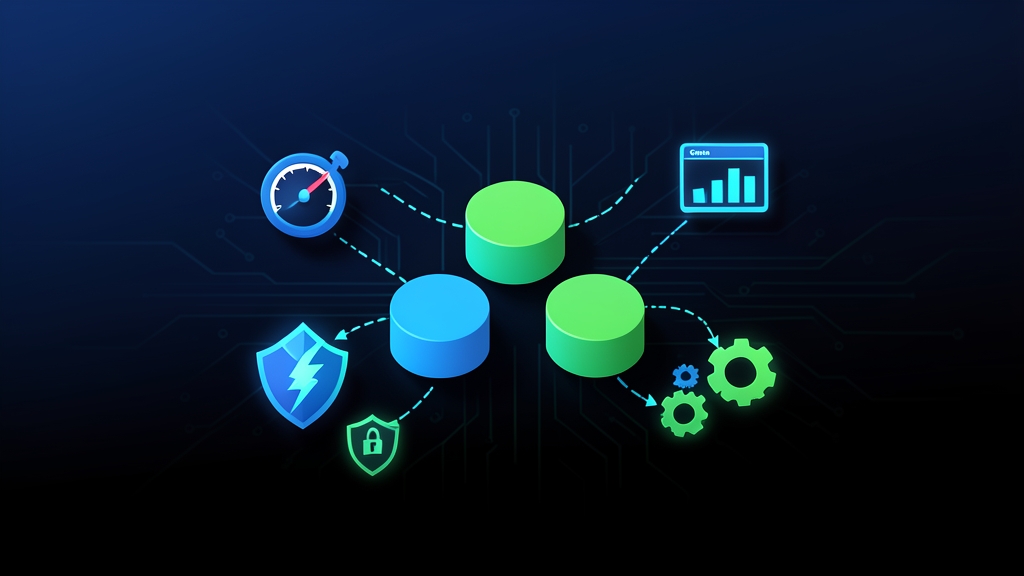
Monitoring etcd Clusters with Prometheus and Grafana: Tracking Disk Fsync Latency, Raft Proposals, and Leader Changes to Protect the Kubernetes Control Plane
A practical guide to configuring Prometheus and Grafana for etcd cluster monitoring — focusing on the three most critical metrics: Disk Fsync Latency, Raft Proposals, and Leader Changes. Based on 6 months of production experience, including alert rules and tips to prevent etcd bottlenecks from taking down the Kubernetes Control Plane.