Don’t Let Log Management Become a Burden
The sight of SSHing into a server and exhaustively typing docker logs -f for 20-30 microservices every time the system “sneezes” is truly a nightmare. If you’re only running 1-2 containers on a budget VPS, this might be fine. But as you scale, digging through individual log files to find errors is like searching for a needle in a haystack.
By default, Docker uses the json-file log driver. This mechanism writes all stdout/stderr to a JSON file on the host’s disk. I once witnessed a server go down after just 4 hours because the log file ballooned to 50GB due to a forgotten log-rotate configuration.
In a previous e-commerce project, I lost two whole days just trying to find the cause of a memory leak. Containers were crashing repeatedly, Docker would auto-restart them, and just like that, the old logs vanished. After that setback, I realized: To be professional, you must use Fluent-bit for centralized logging.
Fluent-bit: The Logstash Killer in the Lightweight Segment
Many developers immediately think of the ELK Stack when it comes to logging. However, Logstash runs on the JVM and is extremely resource-intensive. It typically “eats” at least 500MB of RAM just to start up. For servers with modest configurations, dedicating 1GB of RAM just to run a log collection bot is a luxury.
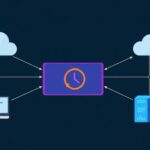
Fluent-bit is a different story. Written in C, it consumes only about 15-20MB of RAM but is powerful enough to process thousands of log events per second. In this architecture, the Docker Fluentd Log Driver pushes logs to Fluent-bit. From there, Fluent-bit coordinates the data to Elasticsearch, Loki, or simply saves it to a centralized file.
3 Steps to Deploy a Centralized Logging System
Step 1: Set Up the Fluent-bit Configuration File
First, create the fluent-bit.conf file. This file acts as the brain, specifying where to receive and where to send logs:
[SERVICE]
    Flush        1
    Daemon       Off
    Log_Level    info
    Parsers_File parsers.conf

[INPUT]
    Name   forward
    Listen 0.0.0.0
    Port   24224

[OUTPUT]
    Name   stdout
    Match  *
I’m using the forward input to listen on port 24224. The output is temporarily set to stdout. This makes it easy to debug and see logs appearing directly on the Fluent-bit console.
Step 2: Deploy Fluent-bit with Docker Compose
Using Docker Compose makes managing this “log vacuum” much easier. Create a docker-compose.yml file as follows:
services:
  fluent-bit:
    image: fluent/fluent-bit:latest
    container_name: fluent-bit
    volumes:
      - ./fluent-bit.conf:/fluent-bit/etc/fluent-bit.conf
    ports:
      - "24224:24224"
      - "24224:24224/udp"
    restart: always
Just type docker-compose up -d, and your log collection system is ready to go.
Step 3: Configure Applications to Push Logs
Instead of letting Docker write logs to JSON files, we will direct the data stream to Fluent-bit. There are two ways to do this:
Method 1: Using the Run command directly
docker run --log-driver=fluentd \
           --log-opt fluentd-address=localhost:24224 \
           --log-opt tag="web-app-production" \
           nginx
Method 2: Configuration in Docker Compose (Recommended)
services:
  web-app:
    image: nginx:latest
    logging:
      driver: fluentd
      options:
        fluentd-address: "localhost:24224"
        tag: "nginx.logs"
        fluentd-async: "true"
Believe me, the fluentd-async: "true" option is a lifesaver. If Fluent-bit goes down and async isn’t enabled, your application container could hang (blocking I/O). Asynchronous mode ensures the application keeps running smoothly even if the logging system encounters an issue.
Testing and Real-world Operation
After launching, access your application to generate some log lines. Check the results with the command:
docker logs -f fluent-bitIf you see Nginx logs appearing as JSON with the nginx.logs tag, you’ve succeeded. For a more professional setup, change the [OUTPUT] section to push logs to Grafana Loki:
[OUTPUT]
    Name        loki
    Match       *
    Host        loki-server-address
    Port        3100
    Labels      job=docker_logs
“Hard-won” Lessons from Operation
To prevent your logging system from becoming a burden, keep these 3 key points in mind:
- Buffer Configuration: If Elasticsearch responds slowly, Fluent-bit will accumulate logs in RAM. When RAM is full, logs will be dropped. Configure
storage.type filesystemto buffer logs to the disk when necessary. - Smart Tagging: Don’t use generic tags. Use variables like
{{.Name}}to distinguish logs between different instances of the same service. - Security: Port 24224 has no password by default. Never open this port publicly on a VPS unless you want bad actors to spam logs and fill up your hard drive.
Setting up Fluent-bit initially might take an extra 15-20 minutes. However, the peace of mind when the system runs stably is a reward well worth it.