Is your server running fine? Is your database responding? Are your API endpoints timing out? These questions go unanswered without a monitoring system in place — and more often than not, you only find out something’s wrong when a customer complains first.
I’ve been there: a VPS running an application went down at 2 AM, and I only found out the next morning when a customer called. That day I decided to install monitoring on every server — and after trying many tools, Uptime Kuma is the one I’ve kept running on over 20 VPSes.
Comparing Server Monitoring Options
Before diving into the installation, let’s look at the popular options to understand why Uptime Kuma is a great fit for most individual and small business use cases.
Zabbix / Nagios — Enterprise-grade but Heavy
Zabbix and Nagios are classic, extremely powerful monitoring tools: they track CPU, RAM, disk, network, support multi-channel alerts, and provide detailed historical reports. But to fully set up Zabbix, you need at least 30–60 minutes of configuration, plus knowledge of SNMP, Zabbix agents, and templates. For developers or sysadmins managing a handful of personal servers, this is obvious overkill.
- Pros: Deep monitoring, extensive metrics, enterprise-ready.
- Cons: Complex setup, high RAM usage (Zabbix server needs ~512MB dedicated), steep learning curve.
Prometheus + Grafana — Powerful but Requires Expertise
The Prometheus + Grafana stack is the go-to choice for professional DevOps teams. Beautiful dashboards, flexible alerting, excellent Kubernetes integration. But configuring an alert rule in Alertmanager requires writing YAML, understanding PromQL, and debugging why metrics aren’t being pulled.
- Pros: Flexible, scalable, top-tier visualization.
- Cons: Requires deep DevOps knowledge, no easy out-of-the-box public status page.
UptimeRobot / Better Uptime — Convenient SaaS but You Lose Control
SaaS services like UptimeRobot (free), Better Uptime, and Freshping are very convenient — no installation required. But you’re dependent on a third party, your data lives on their servers, and free plans usually limit the number of monitors or check frequency.
Uptime Kuma — Self-hosted, Simple, and Gets the Job Done
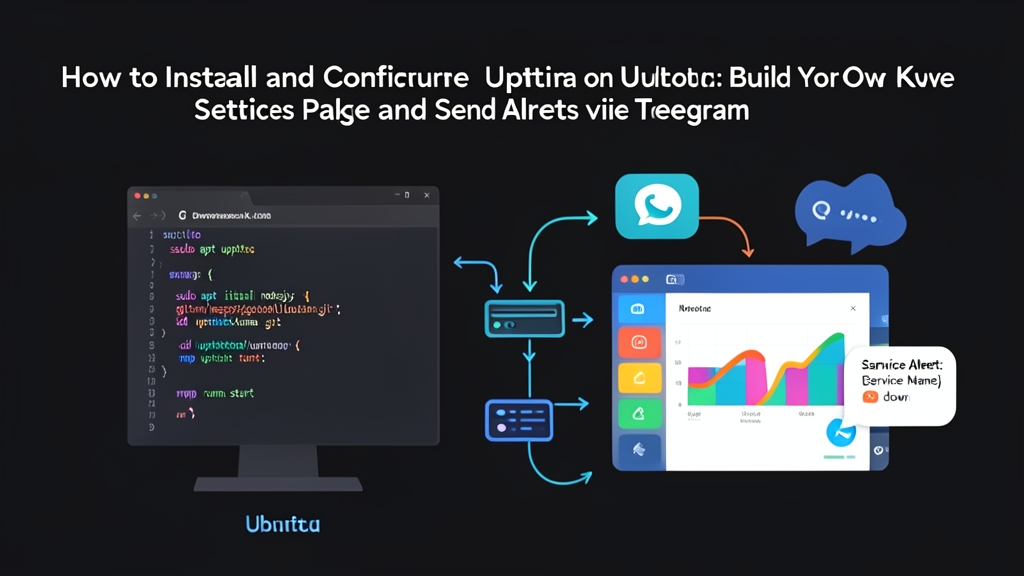
Uptime Kuma is a self-hosted monitoring tool with a clean interface similar to UptimeRobot, but running entirely on your own server. Install it with Docker in under 2 minutes — it supports 20+ monitor types (HTTP, TCP, DNS, Docker containers…), alerts via Telegram/Slack/Discord/Email, and includes a public Status Page to share with your customers. All data is stored in a single SQLite file — simple to back up, easy to migrate.
Analysis: When Should You Use Uptime Kuma?
Uptime Kuma isn’t the most comprehensive monitoring tool — it doesn’t measure CPU load or chart memory usage over time. But if your goal is to know immediately when a service goes down and have a status page to share with users, Uptime Kuma handles that beautifully without requiring any additional infrastructure investment.
Choose Uptime Kuma when: you need a quick setup, want minimal maintenance, have a small server (1–2 vCPU), or need a public status page for customers. Choose Prometheus+Grafana when: you need detailed metrics, have a DevOps team, or manage large multi-node infrastructure.
Installing Uptime Kuma on Ubuntu
Method 1: Docker (Recommended)
If your server already has Docker installed, this is the fastest and easiest method to maintain. Everything runs inside a container without affecting the host system.
# Create directory for data storage
mkdir -p /opt/uptime-kuma/data

# Run the container
docker run -d \
  --name uptime-kuma \
  --restart unless-stopped \
  -p 3001:3001 \
  -v /opt/uptime-kuma/data:/app/data \
  louislam/uptime-kuma:1
If you prefer Docker Compose (I personally use this approach — it’s easier to manage long-term):
# /opt/uptime-kuma/docker-compose.yml
services:
  uptime-kuma:
    image: louislam/uptime-kuma:1
    container_name: uptime-kuma
    restart: unless-stopped
    ports:
      - "3001:3001"
    volumes:
      - ./data:/app/data
cd /opt/uptime-kuma
docker compose up -dMethod 2: Direct npm Installation
Use this when your server doesn’t have Docker or you want to avoid the container layer:
# Install Node.js 18+ if not already installed
curl -fsSL https://deb.nodesource.com/setup_18.x | sudo -E bash -
sudo apt install -y nodejs

# Clone and install Uptime Kuma
git clone https://github.com/louislam/uptime-kuma.git /opt/uptime-kuma
cd /opt/uptime-kuma
npm run setup

# Run as a service using PM2
npm install pm2 -g
pm2 start server/server.js --name uptime-kuma
pm2 startup
pm2 save
I prefer Docker because migrating or backing up only requires copying the /opt/uptime-kuma/data directory. Updating Uptime Kuma later is just a docker pull and container restart.
Adding Your First Monitor
Visit http://your-server-ip:3001, create an admin account, then click Add New Monitor:
- Monitor Type: HTTP(s) for websites, TCP Port for databases/Redis
- Heartbeat Interval: 30–60 seconds for production, 5 minutes for less critical services
- Retries: 2–3 times before marking as down (avoids false alarms from brief network hiccups)
Pro tip: Use the Keyword monitor type instead of plain HTTP. It checks both the HTTP status code and whether the response body contains a specific string — catching cases where the server returns 200 OK but is actually displaying an error page.
Setting Up Telegram Alerts
Telegram is my go-to alert channel: instant delivery to your phone, no spam filters like email, and much faster to set up than SMTP.
Step 1: Create a Telegram Bot
- Open Telegram and search for @BotFather
- Type
/newbot, then set a name and username for your bot - BotFather will return a Bot Token in the format
123456789:ABCdef...— save this
Step 2: Get Your Chat ID
# Send a message to the bot first, then run this command:
curl "https://api.telegram.org/bot<YOUR_BOT_TOKEN>/getUpdates"

# Find "chat":{"id": 123456789} in the response
# Group Chat ID is a negative number: -100...
Step 3: Configure in Uptime Kuma
- Go to Settings → Notifications → Add Notification
- Type: Telegram
- Enter your Bot Token and Chat ID, then click Test
- Save and assign the notification to the monitors you want to alert
Uptime Kuma sends alerts both when a service goes down and when it recovers — you know immediately when the issue is resolved without having to check the dashboard.
Creating a Public Status Page
Go to Status Page → New Status Page, set a URL slug (e.g., status), add the monitors you want to display, and customize the appearance. Customers can visit http://your-ip:3001/status/status to view real-time uptime.
To access it via a custom domain like status.yourdomain.com, you’ll need an Nginx reverse proxy:
server {
    listen 80;
    server_name status.yourdomain.com;

    location / {
        proxy_pass http://localhost:3001;
        proxy_set_header Host $host;
        proxy_set_header X-Real-IP $remote_addr;
        proxy_http_version 1.1;
        # Required for real-time WebSocket
        proxy_set_header Upgrade $http_upgrade;
        proxy_set_header Connection "upgrade";
    }
}
The Upgrade and Connection lines are mandatory — Uptime Kuma uses WebSocket for real-time updates, and without them the dashboard won’t auto-refresh.
Practical Tips from Real-World Use
Back up your data daily: All configuration and history is stored in /opt/uptime-kuma/data/kuma.db. A simple cron job is all you need:
# Backup every day at 2:00 AM
0 2 * * * cp /opt/uptime-kuma/data/kuma.db /backup/kuma-$(date +\%Y\%m\%d).db
Monitor Uptime Kuma from the outside: Uptime Kuma can’t monitor itself. Use the free UptimeRobot (1 monitor is enough) to ping your Uptime Kuma instance — if it goes down, you’ll still get an alert.
Monitor internal services too: Most people only monitor public URLs, but you should also add TCP monitors for your database port, Redis port, and internal APIs. Sometimes the reverse proxy still returns 200 while the backend has been dead for a while.
I’ve set up Ubuntu Server 22.04 on over 20 VPSes, and installing Uptime Kuma is always the first thing I do — right after setting up SSH keys and the firewall. Having monitoring in place from day one means you catch problems before users do, and when incidents happen, you have concrete uptime history data instead of having to guess.