When SQL LIKE Queries Run Out of Steam
Almost every developer has written queries like SELECT * FROM products WHERE name LIKE '%keyword%'. When your table only has a few thousand rows, the database responds in the blink of an eye.
Now imagine that table reaches 10 million records. A LIKE '%...%' query forces a full table scan, pegging your CPU and sending response times skyrocketing from 20ms to 3–5 seconds. To make matters worse, your product owner asks: ‘The system needs to tolerate typos (fuzzy search), support instant autocomplete, and ingest 50GB of logs daily for debugging.’ At this point, traditional RDBMSs simply can’t keep up.
MySQL and PostgreSQL excel at ACID transactions (billing, orders). MongoDB offers flexibility for dynamic document schemas. However, for complex full-text search and real-time analytics across millions of log entries, you need a specialized tool. Today, OpenSearch is the standout choice.
Core Concepts: How Does OpenSearch Work?
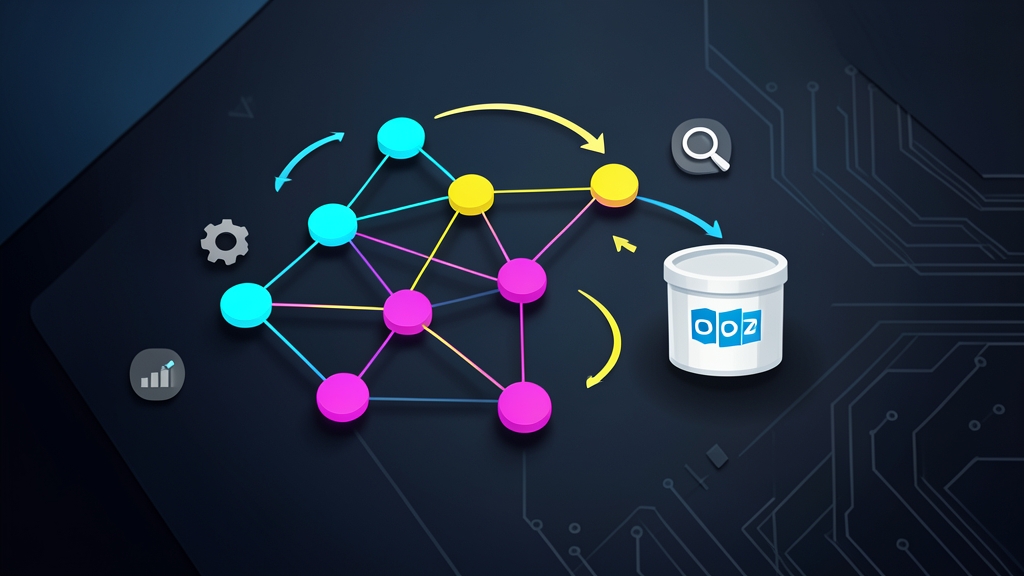
Think of it this way: a relational database is like a 1,000-page book. If you want to find a specific word, you have to flip through every single page. In contrast, OpenSearch operates like the index at the back of the book (an Inverted Index). It records upfront that the keyword ‘Docker’ appears on pages 15 and 88, while ‘Cluster’ is on page 200. Thanks to this inverted index mechanism, OpenSearch can return results in 10–30 milliseconds—even across collections spanning tens of millions of documents.
The Elasticsearch Licensing Turning Point
Many developers are already familiar with the ELK Stack (Elasticsearch, Logstash, Kibana). In early 2021, Elastic moved away from its open-source license (Apache 2.0) to the SSPL—a dual license restricting cloud providers from offering Elasticsearch as a managed commercial service.
To safeguard the open-source community, AWS joined forces with Red Hat, SAP, and others to fork the final Apache 2.0-licensed codebases (version 7.10.2) of Elasticsearch and Kibana. They continued development as OpenSearch and OpenSearch Dashboards. The project is completely free, licensed under Apache 2.0, and maintains near-100% compatibility with the Elasticsearch REST APIs.
Two Core Components to Remember
- OpenSearch: The distributed storage engine and search algorithm execution layer (built on Apache Lucene).
- OpenSearch Dashboards: The browser-based visualization UI. It allows you to build charts, query logs, and monitor cluster health without having to write raw curl API requests.
Hands-On: Setting Up OpenSearch with Docker Compose
Using Docker Compose gives you a clean sandbox environment in under 2 minutes without cluttering your host OS. We will spin up a single-node OpenSearch cluster (temporarily disabling internal security plugins for ease of learning) alongside an OpenSearch Dashboards instance.
Step 1: Prepare docker-compose.yml
Create a working directory and open the configuration file:
mkdir opensearch-lab && cd opensearch-lab
nano docker-compose.yml
Paste the following configuration into the file:
version: '3.8'

services:
  opensearch-node:
    image: opensearchproject/opensearch:2.12.0
    container_name: opensearch-node
    environment:
      - cluster.name=opensearch-cluster
      - node.name=opensearch-node
      - discovery.type=single-node
      - bootstrap.memory_lock=true
      - "OPENSEARCH_JAVA_OPTS=-Xms512m -Xmx512m"
      - DISABLE_SECURITY_PLUGIN=true
    ulimits:
      memlock:
        soft: -1
        hard: -1
      nofile:
        soft: 65536
        hard: 65536
    volumes:
      - opensearch-data:/usr/share/opensearch/data
    ports:
      - 9200:9200
      - 9600:9600
    networks:
      - opensearch-net

  opensearch-dashboards:
    image: opensearchproject/opensearch-dashboards:2.12.0
    container_name: opensearch-dashboards
    ports:
      - 5601:5601
    environment:
      - 'OPENSEARCH_HOSTS=["http://opensearch-node:9200"]'
      - DISABLE_SECURITY_DASHBOARDS_PLUGIN=true
    networks:
      - opensearch-net
    depends_on:
      - opensearch-node

volumes:
  opensearch-data:

networks:
  opensearch-net:
Step 2: Configure the Kernel and Launch
Each Lucene process running in a container requires a substantial number of memory-mapped areas. On Linux hosts, increase the virtual memory limit before starting the containers:
sudo sysctl -w vm.max_map_count=262144
docker compose up -d
Wait around 20 seconds for the node to complete initialization. Then, verify the cluster status with:
curl http://localhost:9200If the terminal returns a JSON payload containing "tagline" : "The OpenSearch Project: https://opensearch.org/" and version details, your cluster is up and ready to ingest data.
Step 3: Indexing and Testing Queries
Let’s index two sample documents using the REST API:
# 1. Add the first document
curl -X POST "http://localhost:9200/articles/_doc/1" -H 'Content-Type: application/json' -d'{
  "title": "Guide to Learning Programming from Scratch",
  "author": "Nguyen Van A",
  "content": "Learning programming takes patience, starting with the fundamentals of variables and loops.",
  "tags": ["it", "coding", "beginner"]
}'

# 2. Add the second document
curl -X POST "http://localhost:9200/articles/_doc/2" -H 'Content-Type: application/json' -d'{
  "title": "Best Practices for Managing Large Databases",
  "author": "Tran Van B",
  "content": "Optimizing SQL queries and analyzing system logs help minimize server outages.",
  "tags": ["database", "devops"]
}'
Now comes the fun part: searching for articles containing the terms ‘database’ or ‘log’:
curl -X GET "http://localhost:9200/articles/_search" -H 'Content-Type: application/json' -d'{
  "query": {
    "match": {
      "content": "database log"
    }
  }
}'
OpenSearch automatically tokenizes the search input, computes relevance scores via the BM25 algorithm, and returns document #2 as the top hit within a few milliseconds.
Step 4: Exploring OpenSearch Dashboards
Open your browser and navigate to http://localhost:5601. The management console will appear right away. Here you’ll find:
- Dev Tools: An interactive console with syntax autocompletion to write and test JSON queries directly.
- Discover & Dashboards: Tools to filter millions of log lines across time ranges and visualize 500 error spikes or latency using bar charts and heatmaps.
Wrapping Up
Do not treat OpenSearch as a drop-in replacement for MySQL or PostgreSQL. It was never intended to handle transactional order processing or strict database locks. Instead, the standard industry pattern is to keep your RDBMS as the primary source of truth, then stream or sync search and log data into OpenSearch.
This hybrid architecture gives you the best of both worlds: rock-solid transactional safety alongside blazing-fast search speeds, entirely free from commercial licensing hurdles.