Posted inMonitoring
Monitor Directory Sizes with Prometheus Folder Exporter: Don’t Wait for a Full Disk to Panic
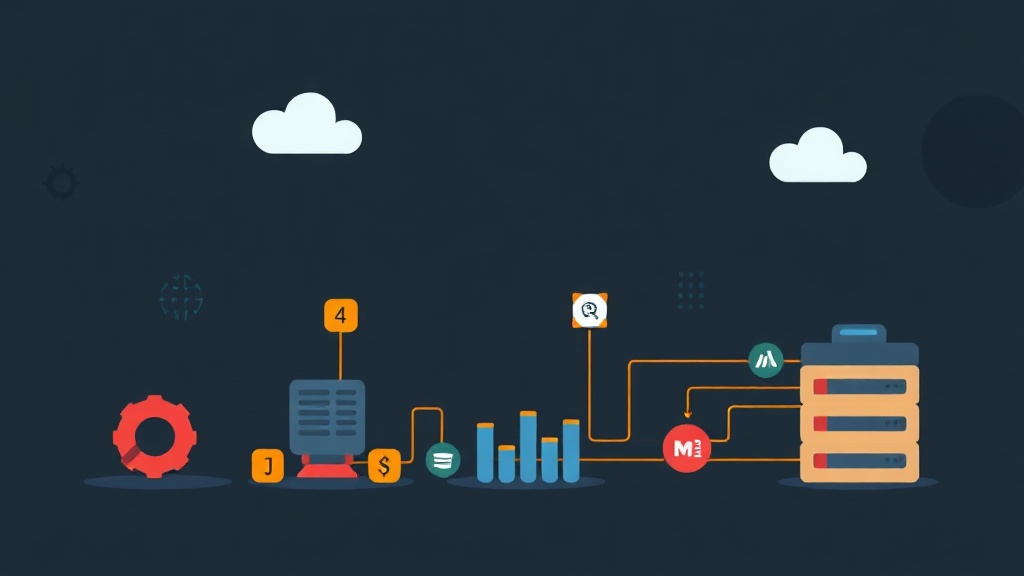
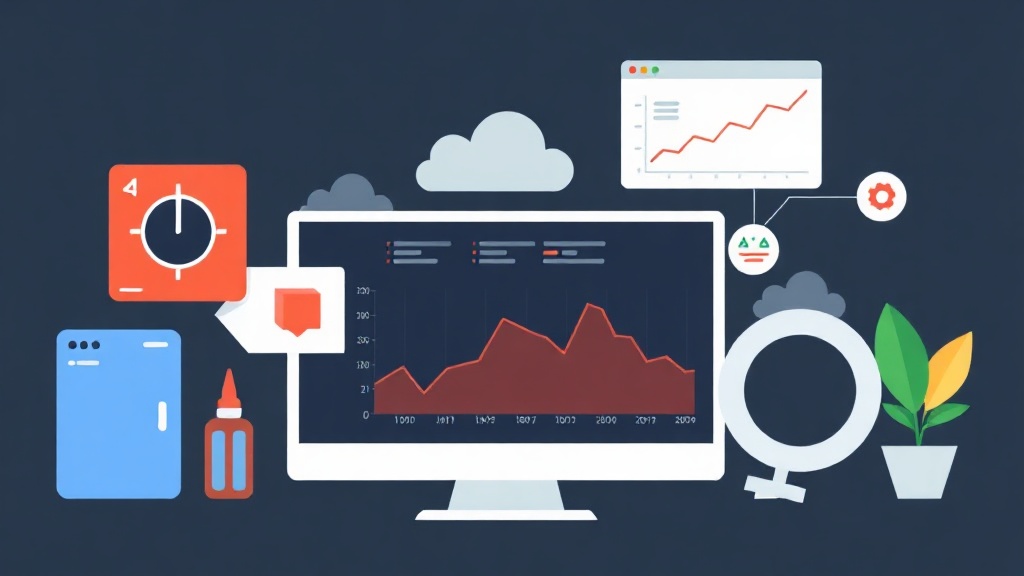
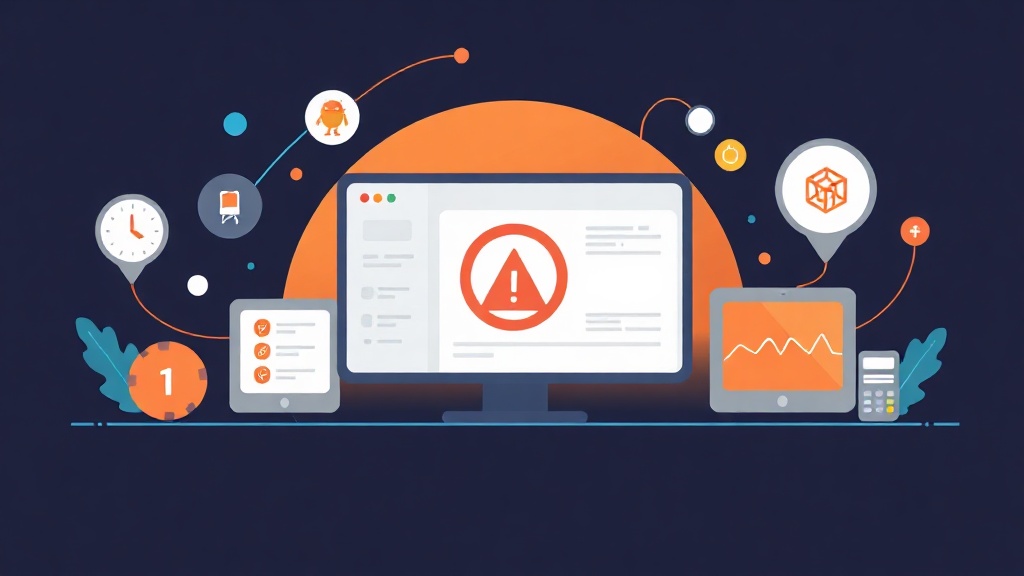
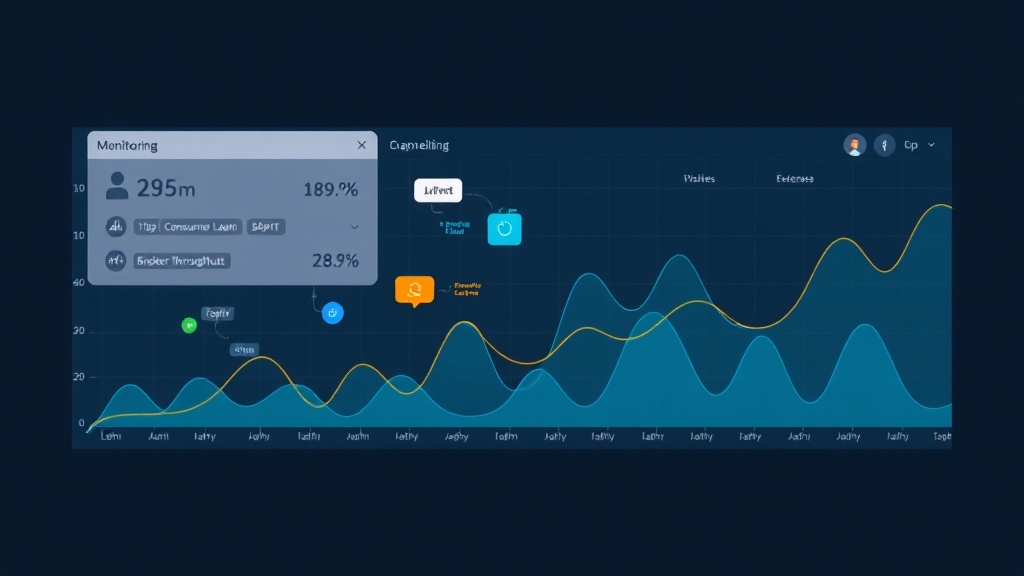
Stop SSHing into servers at 2 AM to find bloated log files. Use Prometheus Folder Exporter to monitor directory sizes and get early alerts.