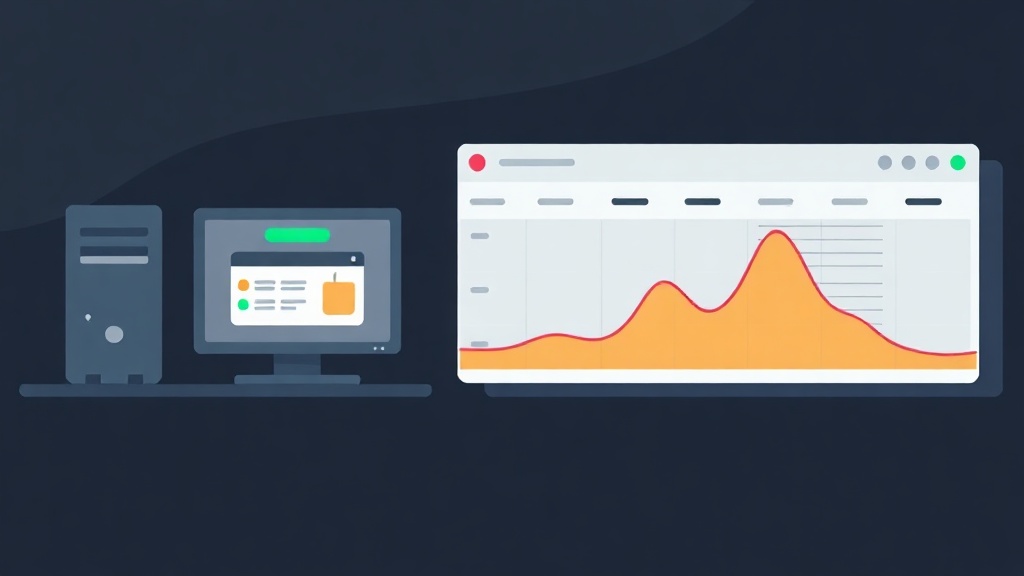
The “Event Viewer” Nightmare During System Failures
If you’ve ever worked as a System Admin, you’re likely familiar with the 2 AM wake-up call: “The server is down!”. The old-fashioned routine begins: Open RDP, log into each server, type eventvwr.msc, and strain your eyes filtering through thousands of System and Application log lines. If you’re managing a cluster of 20-30 servers, it’s like finding a needle in a haystack.
In reality, we shouldn’t be searching for logs. Let the logs find us. With the duo of Grafana Alloy and Loki, all Event Logs from your Windows Server fleet are pushed to a single repository. Instead of spending 30 minutes logging into each machine, you only need 30 seconds to run a query on Grafana to pinpoint exactly where the error is.
In this article, I will guide you through setting up this system using Grafana Alloy. This is the next-generation tool that completely replaces Grafana Agent with superior performance and much more flexible configuration.
Quick Start: Deploy in 5 Minutes
Assuming you already have a Loki cluster. If not, you can temporarily use Grafana Cloud (free 50GB log/month) to test it out immediately.
Step 1: Install Grafana Alloy
First, download the .msi installer from the Grafana Labs GitHub. Run the file on your Windows Server and keep the default options. Once installed, Alloy will automatically run as a Windows Service with extremely low resource consumption, around 40-60MB of RAM.
Step 2: Configure the config.alloy file
Locate the configuration file at C:\Program Files\GrafanaLabs\Alloy\config.alloy. Delete the default content and replace it with the following minimalist code snippet:
loki.source.windowsevent "windows_logs" {
  event_log_name = "System,Application,Security"
  forward_to     = [loki.write.central_loki.receiver]
}

loki.write "central_loki" {
  endpoint {
    url = "http://<LOKI_IP>:3100/loki/api/v1/push"
  }
}
Note: Don’t forget to replace <LOKI_IP> with your server’s address.
Step 3: Restart and Verify Results
Open Services.msc, find Grafana Alloy, and click Restart. Now, open Grafana, go to the Explore section, and select the Loki source. Run the query {job="windows_logs"}. You will see logs from Windows starting to stream in real-time.
Why Choose Grafana Alloy Over Promtail?
Many people still use Promtail, but Alloy is the future. Alloy doesn’t just collect logs; it also handles Metrics and Traces according to the OpenTelemetry standard.
The structure of Alloy is based on Components. You declare functional blocks and connect them like Lego bricks. This approach makes log filtering and labeling extremely transparent. Notably, Alloy handles Windows logs more smoothly, rarely experiencing pipeline congestion when log volume spikes.
Production Configuration: Filtering Junk Logs to Save Resources
Pushing all “Information” logs to the server is a critical mistake. It wastes bandwidth and fills up your hard drive quickly. My recommendation is to only collect Error (Level 1) and Warning (Level 2) logs.
Below is the configuration file I typically use for real-world projects:
loki.source.windowsevent "windows_critical_logs" {
  event_log_name = "System,Application"
  # Filter directly using XPath to reduce CPU load
  xpath          = "*[System[(Level=1 or Level=2)]]"
  forward_to     = [loki.relabel.add_labels.receiver]
}

loki.relabel "add_labels" {
  forward_to = [loki.write.central_loki.receiver]

  rule {
    target_label = "hostname"
    replacement  = "SRV-DB-PROD-01"
  }
  rule {
    target_label = "tier"
    replacement  = "database"
  }
}

loki.write "central_loki" {
  endpoint {
    url = "http://192.168.1.100:3100/loki/api/v1/push"
    auth {
      username = "loki_user"
      password = "your_secure_password"
    }
  }
}
Using xpath helps filter logs directly at the source. This method reduces the amount of unnecessary data transmitted over the network by 70-80%.
3 Pro Tips for Log Management
1. Monitor Security Logs to Detect Brute-force Attacks
Pay attention to Event ID 4625 (failed login). If hundreds of these logs arrive within a minute, your server is definitely under attack. You can set up an Alert on Grafana to receive instant notifications via Telegram.
2. Leverage Community Dashboards
Don’t waste time building Dashboards from scratch. Visit Grafana Dashboards and search for ID 12239 or the keyword “Windows Logs”. Simply import this ID, and you’ll have an immediate visual overview of your server’s health.
3. Troubleshooting When Logs Don’t Appear
If the configuration is correct but logs still aren’t showing up, check Alloy’s log file at: C:\ProgramData\GrafanaLabs\Alloy\data\alloy.log. Most errors stem from incorrect Loki URLs or firewalls blocking port 3100.
Conclusion
Switching to centralized log management with Grafana Alloy is the right move for modernizing your infrastructure. It will make your job easier, the system more stable, and most importantly, you’ll no longer dread those midnight calls. Try setting it up today—it only takes 5 minutes, but the value it provides is immense!