The Problem: When Commits Become a “Tangled Mess”
Leading a dev team of 5-10 people, I’ve often found myself “blind to information” even though code is being pushed constantly. The project keeps moving, but when I need to look back at the big picture to see who is focusing on which module, or which files are changing too much (code churn) causing instability, I get stuck.
Using raw git log is like reading a novel without a table of contents. You see every detail for debugging, but for summarizing reports or evaluating progress, it’s a nightmare. I can’t sit and count every line to know how many tasks Person A completed this week, or if Person B is “spamming” meaningless commits.
The Cause: Default Git Log Isn’t Built for Statistics
By nature, git log is a diary recording every change over time. It’s excellent for tracing, but terrible for aggregating data for several reasons:
- Noise: Minor commits like “fix typo” or “update readme” are interspersed with major features, diluting the data.
- Lack of Quantification: You can’t determine the actual workload (lines added/deleted) without scrutinizing every commit.
- Hard to Categorize: Filtering contributions by member over a specific timeframe while keeping it organized is nearly impossible with basic log commands.
The Solution: From Built-in Commands to Specialized Tools
To solve this, I usually apply three levels of approach depending on whether I need quick stats or deep analysis.
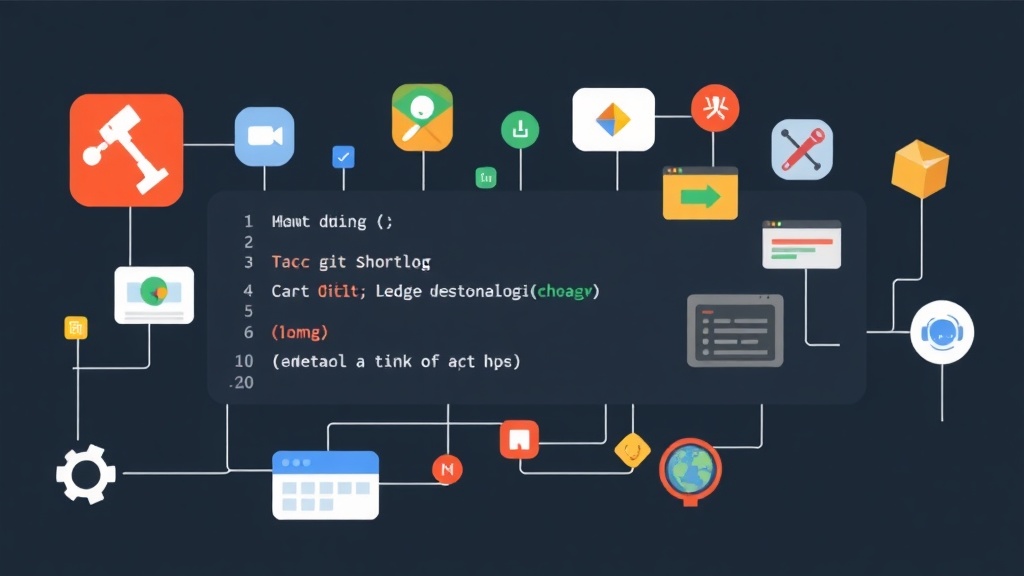
1. Git Shortlog: The Powerful “Instant” Tool
This is a built-in command in Git. Instead of listing details, it groups commits by author. I use this most often during quick weekend sync meetings.
# Summarize commit counts for each person, sorted from most to least
git shortlog -sn

# View commit titles for each person over the last 14 days
git shortlog --since="14 days ago"
Pros: Runs instantly without installation, millisecond response time.
Cons: Only counts the number of commits; it doesn’t show task complexity.
2. Git log –stat: Scrutinizing the Workload
To see if someone is truly “grinding” or just coasting, I use --stat. This command breaks down the files changed and the specific lines added/deleted by each person.
# Statistics for a specific dev since the start of 2024
git log --author="Hoang Nguyen" --since="2024-01-01" --stat
3. Third-Party Tools: git-quick-stats and git-effort
When a project enters a complex maintenance phase, I need to know which files are “hotspots” (changing too frequently). At this point, default commands start showing their visual limitations.
Practical Implementation Guide
Method 1: Quick Reporting for Sprint Reviews
To prepare for a Sprint Review, I usually run the following command to get an overview of the team’s contributions:
git shortlog -sn --all --no-merges-s: Summary (only shows totals).-n: Numbered (sorts descending to see who is most active).--all: Scans all branches, including code in feature branches.--no-merges: Excludes merge commits. This is crucial because merge commits often don’t contain new code; including them skews the actual data.
Pro Tip: Once, I saw a dev with 300 commits while others only had 50. Checking with git shortlog -e, I found they were using two different emails (personal and work). I used a .mailmap file to merge identities, making the report accurate.
Method 2: Finding “Bug Nests” with Git Effort
In every project, there are “sensitive” code files that break whenever they’re touched. I call these Hot Files. To identify them, I use git-effort from the git-extras toolkit.
# Quick installation on Ubuntu
sudo apt install git-extras

# Find which files are modified most frequently
git effort --active
This command displays the active days and the total number of commits impacting a file. If auth_service.py has 150 commits in 3 months, it’s clearly a top candidate for an immediate Refactor.
Method 3: Visual Dashboard with git-quick-stats
If you prefer a professional feel with an interactive menu right in the terminal, git-quick-stats is the #1 choice.
# After installation, launch with the command
git-quick-stats
The Contribution stats by author section will show you a monthly contribution chart. Looking at this, I can easily spot when the team is overloaded or when productivity drops, allowing for timely workload adjustments.
Comparison of Methods
| Criteria | Git Shortlog | Git Log –stat | Git-quick-stats |
|---|---|---|---|
| Ease of Use | Very High (Built-in) | Medium | Requires Installation |
| Level of Detail | Low (Count only) | Good (Lines of code) | Deep (Charts) |
| Best For | Quick reports | Task verification | System analysis |
Conclusion: Don’t Let the Numbers Deceive You
After years of management, I’ve learned a hard lesson: The number of commits or lines of code is never directly proportional to skill level.
A Senior Dev might push just one commit with 10 lines of code but completely solve a critical logic bug. Meanwhile, a Junior might struggle for a week with 50 minor commits and still not finish the task. Use these tools as a compass for direction, not as the sole KPI metric.
My habit is to combine git shortlog with code reviews. If I see someone with too many “update” junk commits, I’ll guide them to use git commit --amend or squash commit to keep the project history clean and professional.