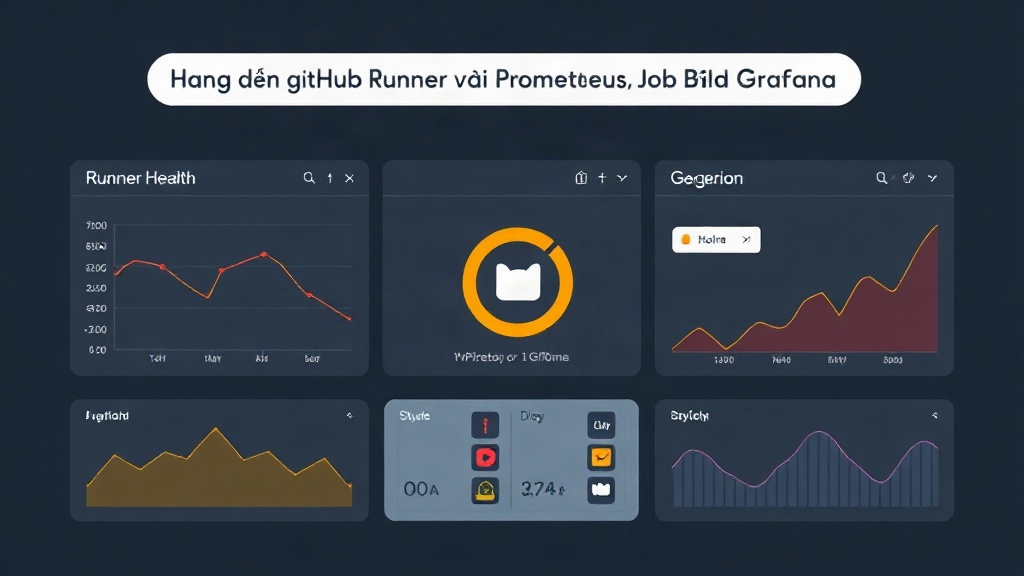
1. Real-World Challenges of Running Self-Hosted GitHub Actions Runners
When a team scales to 20–30 developers, the cost of GitHub-hosted runners spikes rapidly. Migrating to a self-hosted runner cluster on AWS EC2, VPS, or Kubernetes is a sensible choice to optimize your budget. However, managing your own infrastructure introduces numerous operational headaches:
- Runners silently disappear or freeze: Docker build cache bloat fills up the disk (100% disk usage), or the
Runner.Listenerprocess crashes due to OOM (Out Of Memory). As a result, pipelines stall indefinitely without clear error messages. - Persistent job queue bottlenecks: Developers complain that even a small typo-fix commit takes 15–20 minutes just to start running. Meanwhile, the DevOps team is left guessing whether the infrastructure lacks machines or someone triggered a 50-job matrix build that hogged the entire worker pool.
- Abnormally long build times: A pipeline that usually takes 5 minutes suddenly shoots up to 18 minutes. Without historical metrics, it’s impossible to pinpoint which step slowed down: whether pulling Docker base images was throttled by network issues, code compilation starved the CPU, or the test suite bloated.
Before implementing monitoring (similar to monitoring Jenkins pipelines with Prometheus), every time a developer pinged “Hey, CI is broken!”, I had to SSH into each server and blindly run htop or df -h. Centralized monitoring eliminates this hassle: you can spot issues on your dashboard before the team even opens Slack to report them.
2. Root Cause Analysis
This loss of visibility typically stems from two major blind spots:
1. The GitHub UI Hides All Hardware Metrics
The Runner Settings tab in the GitHub UI only shows 3 statuses: Idle, Active, or Offline. You have no way of knowing whether an Active machine is bottlenecked at 99% CPU utilization, disk IOPS is overloaded by overlapping caches, or why it spent 10 full minutes just unpacking artifacts.
2. Lack of Time-Series Metrics and Proactive Alerting
GitHub does not store historical performance metrics as time-series data. During peak release windows (often Friday at 4–5 PM), runner shortages become critical. At that moment, you lack any quantitative data: what the average queue length is, how long queue latency lasts, or how the failure rate is distributed across runner pools.
3. Comparing Common Approaches
DevOps engineers generally consider three approaches:
- Writing cron scripts that query the GitHub REST API and notify Slack/Telegram: Quick to set up in 30 minutes. Major drawbacks: easily hits GitHub API rate limits (5,000 req/hr), lacks visual dashboards, and cannot store long-term trends.
- Forwarding all runner logs to ELK/Loki: Great for inspecting detailed stack traces. However, parsing logs in real time to calculate queue latency and resource utilization is both resource-heavy and cumbersome.
- Standard multi-tier monitoring with Prometheus + Exporters + Grafana: Simultaneously collects infrastructure metrics (Node Exporter) and workflow/queue metrics (github-actions-exporter). This is the standard production model: lightweight, robust, and highly flexible for alerting.
4. Implementation Guide: Comprehensive Monitoring with Prometheus and github-actions-exporter
We will deploy a streamlined stack consisting of github-actions-exporter (fetches runner and job data from GitHub), Node Exporter (monitors runner CPU, RAM, and Disk), Prometheus (stores metrics), and Grafana (visualizes dashboards).
Step 1: Generate a GitHub Personal Access Token (PAT)
Navigate to GitHub > Settings > Developer settings > Personal access tokens. Choose Classic or Fine-grained tokens and grant read permissions:
repo: Monitors runners at the individual repository level.admin:orghoặcread:org: Monitors the entire runner pool at the Organization level.
Step 2: Deploy the Monitoring Stack with Docker Compose
Create a docker-compose.yml file on your monitoring server or directly on the runner cluster:
version: '3.8'

services:
  github-actions-exporter:
    image: cmauto/github-actions-exporter:latest
    container_name: github-actions-exporter
    restart: unless-stopped
    environment:
      - GITHUB_TOKEN=ghp_yourPersonalAccessTokenHere123456
      - GITHUB_ORGANIZATION=your-org-name
      - REFRESH_INTERVAL=30s
    ports:
      - "9999:9999"

  node-exporter:
    image: prom/node-exporter:v1.8.1
    container_name: runner-node-exporter
    restart: unless-stopped
    volumes:
      - /proc:/host/proc:ro
      - /sys:/host/sys:ro
      - /:/rootfs:ro
    command:
      - '--path.procfs=/host/proc'
      - '--path.rootfs=/rootfs'
      - '--path.sysfs=/host/sys'
    ports:
      - "9100:9100"

  prometheus:
    image: prom/prometheus:v2.53.0
    container_name: prometheus
    restart: unless-stopped
    volumes:
      - ./prometheus.yml:/etc/prometheus/prometheus.yml
      - prometheus_data:/prometheus
    ports:
      - "9090:9090"

volumes:
  prometheus_data:
Step 3: Configure Prometheus Scrape Targets
Create the prometheus.yml configuration file in the same directory as the Compose file:
global:
  scrape_interval: 15s
  evaluation_interval: 15s

scrape_configs:
  - job_name: 'github_actions'
    static_configs:
      - targets: ['github-actions-exporter:9999']

  - job_name: 'runner_nodes'
    static_configs:
      - targets: ['node-exporter:9100']
Start the services:
docker compose up -d

# Verify if the exporter connected successfully to the GitHub API
docker logs -f github-actions-exporter
Step 4: Battle-Tested PromQL Queries for Grafana Dashboards
After adding Prometheus as a Data Source in Grafana, you can immediately create these core panels using advanced PromQL queries:
1. Runner Health Check
Instantly detect disconnected or crashed runners:
# Number of online runners by pool
sum by (os, status) (github_runner_status{status="online"})

# Alert on offline runners (value = 1 means disconnected)
github_runner_status{status="offline"} == 1
2. Measure Job Queue Latency
Accurately track jobs waiting for resources to trigger autoscaling in time:
# Total queued jobs by repository
sum(github_workflow_job_status_total{status="queued"}) by (repo)

# Ratio of in_progress jobs to queued jobs
sum(github_workflow_job_status_total{status="in_progress"}) /
sum(github_workflow_job_status_total{status="queued"})
3. Monitor Build Duration
Measure average workflow execution time per repository to optimize build caching:
# Average job duration (seconds) over the last 30 minutes
rate(github_workflow_job_duration_seconds_sum[30m]) / rate(github_workflow_job_duration_seconds_count[30m])
Step 5: Configure Alert Rules for Instant Notifications
Add Alert Rules to Prometheus to receive notifications via Slack/Telegram as soon as an issue occurs:
groups:
  - name: github_runner_alerts
    rules:
      - alert: RunnerOffline
        expr: github_runner_status{status="offline"} == 1
        for: 3m
        labels:
          severity: critical
        annotations:
          summary: "Runner {{ $labels.name }} is Offline"
          description: "Runner {{ $labels.name }} in pool {{ $labels.runner_group }} has been disconnected for more than 3 minutes."

      - alert: HighJobQueueCount
        expr: sum(github_workflow_job_status_total{status="queued"}) > 10
        for: 5m
        labels:
          severity: warning
        annotations:
          summary: "CI/CD Job Queue Bottleneck"
          description: "More than 10 jobs have been waiting for an available runner for over 5 minutes. Consider scaling additional workers."
With just a few minutes of setup, you transition from reactive firefighting to proactive observability. Every resource bottleneck, queue delay, and health issue across your runner pool is now clearly in view.