The 2 AM Nightmare and the Challenge of Distributed Alert Management
The clock strikes 2 AM, and the PagerDuty alarm blares. I jump up, eyes half-closed, and open my laptop. The system is facing a major incident on a multi-cluster scale. My company runs Kubernetes across AWS, Google Cloud, and an on-premise cluster. Each location has its own set of Prometheus and Alertmanager instances.
At that moment, I had to frantically open seven browser tabs to check each cluster. One reported a database error, another showed a latency spike. The default Alertmanager interface is quite basic, making troubleshooting extremely slow. I realized: Alert fatigue isn’t just about the number of alerts, but also the fragmentation of management tools.
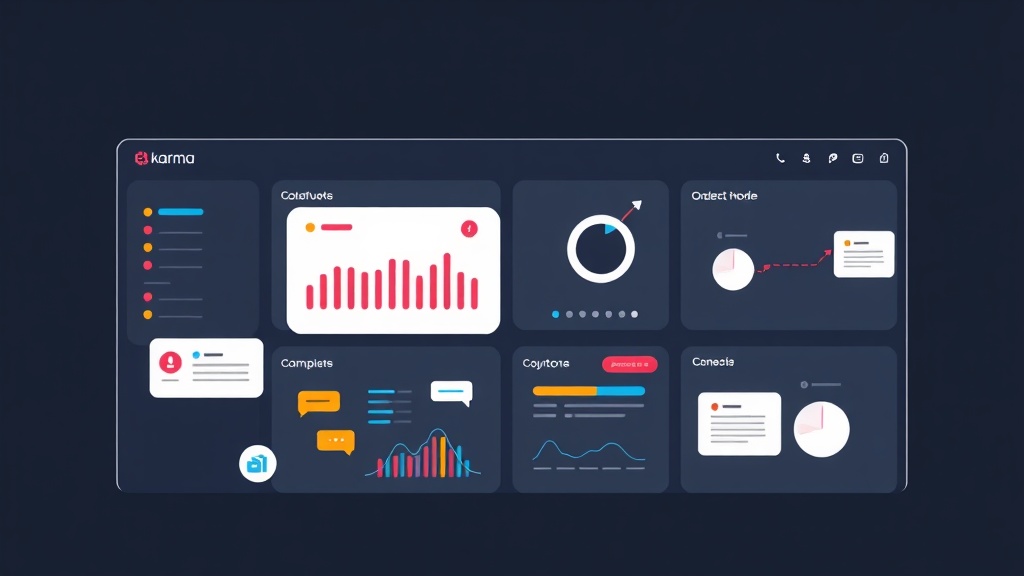
After that “memorable” night, I decided to find a way to bring all this chaos onto a single screen. And Karma was the lifesaver.
Which Tool Should You Choose to Manage Alertmanager?
Before settling on Karma, I tried a few familiar options. Here is my practical perspective:
1. Default Alertmanager UI
- Pros: Built-in, no installation overhead.
- Cons: Outdated interface from a decade ago. It lacks smart grouping and cannot view alerts from multiple sources simultaneously.
2. Grafana Integration
- Pros: Leverages a beautiful, familiar dashboard.
- Cons: Grafana excels at visualization rather than alert lifecycle management. When a system has over 100 simultaneous alerts, the Grafana interface starts to feel heavy and makes quick silence operations difficult.
3. Karma Dashboard (The Optimal Choice)
- Pros: Extremely lightweight and specialized for Alertmanager. It supports powerful regex filtering, flexible label-based grouping, and connects to an unlimited number of backends.
- Cons: You have to spend a bit of effort maintaining this service.
Why Karma is the “True Love” for SREs?
The Filtering capability is what impressed me the most. When a system scales up, you get flooded with thousands of “noise” alerts. With Karma, I just need to type a short query: @state=active severity=critical cluster=prod. Instantly, the most important items appear without missing a single error.
Besides that, the Silence management feature saves me a massive amount of time. Instead of logging into each cluster to temporarily silence alerts, I can handle them centrally right on Karma. During last month’s system maintenance, I reduced my mouse clicks by 80% thanks to this centralized management.
Deploying Karma Dashboard with Docker Compose
The fastest way to get things up and running is using Docker. Here is the configuration I use to manage two Alertmanager clusters (Production and Staging).
Step 1: Create the karma.yaml configuration file
This file is used to declare the Alertmanager endpoints that Karma needs to pull data from.
# karma.yaml
alertmanager:
  interval: 30s
  servers:
    - name: "Prod-Cluster"
      uri: "http://alertmanager-prod:9093"
      timeout: 10s
    - name: "Staging-Cluster"
      uri: "http://alertmanager-staging:9093"
      timeout: 10s

karma:
  name: "Global Alert Dashboard"
  grouping:
    default:
      groupBy: ["alertname", "cluster", "instance"]

ui:
  refresh: 30s
  theme: dark
Step 2: Set up the service with docker-compose.yaml
version: '3.8'
services:
  karma:
    image: ghcr.io/prymitive/karma:latest
    container_name: karma-dashboard
    volumes:
      - ./karma.yaml:/karma.yaml
    environment:
      - CONFIG_FILE=/karma.yaml
    ports:
      - "8080:8080"
    restart: always
Step 3: Activation
Run this command to start:
docker-compose up -dAccess http://localhost:8080, and you will see all alerts organized neatly.
Survival Tips for On-call Seasons
Installation alone isn’t enough. To truly leverage Karma’s power, I usually apply these two tips:
Leverage Regex Filters
Karma’s search bar is very powerful. Try these commands:
alertname=~Cpu.*: Group all CPU-related errors.-cluster=dev: Hide alerts from the dev environment to focus on Prod.@state=suppressed: Check silenced alerts to see if any are about to expire.
Smart Grouping
When a database goes down, dozens of dependent services will report errors. If you don’t group them, the screen turns bright red, causing panic. I usually group by job or app to find the “epicenter” of the incident.
# Add to karma.yaml
karma:
  grouping:
    default:
      groupBy: ["alertname", "service"]
      groupMagicLabel: "cluster" # Automatically split groups if alerts come from different clusters
Real-world Experience from the Field
When I first started as an SRE, I would frantically fix every alert I saw. Later, I realized that about 50% of alerts are noise. Karma helps me spot the patterns of that noise extremely fast.
Example: I discovered a CPU alert that regularly popped up at 1 AM and then disappeared on its own. Looking at Karma, I saw it coincided with the system backup schedule. Instead of staying up for nothing, I created a recurring Silence Rule directly in the Karma interface, and that was it.
Important Note: Karma does not have a built-in login mechanism by default. Never expose it directly to the Internet. Place it behind a VPN or use Nginx Basic Auth to prevent unauthorized users from “accidentally” silencing your alerts.
Conclusion
Centralizing all alerts makes the on-call person’s mindset much more stable. You no longer have to jump between tabs but instead get a comprehensive overview of the entire distributed system. If you are managing two or more Alertmanagers, deploy Karma today to protect your own sleep.